Session 03: Debugging in Unikraft
Because unikernels aim to be a more efficient method of virtualization, this can sometimes cause problems. This session aims to familiarize you to solve any problem encountered during the development using GDB and Tracepoints.
Reminders
At this stage, you should be familiar with the steps of configuring, building and running any application within Unikraft and know the main parts of the architecture. Below you can see a list of the commands you have used so far.
| Command | Description |
|---|---|
kraft list | Get a list of all components that are available for use with kraft |
kraft up -t <appname> <your_appname> | Download, configure and build existing components into unikernel images |
kraft run | Run resulting unikernel image |
kraft init -t <appname> | Initialize the application |
kraft configure | Configure platform and architecture (interactive) |
kraft configure -p <plat> -m <arch> | Configure platform and architecture (non-interactive) |
kraft build | Build the application |
kraft clean | Clean the application |
make menuconfig | Configure application through the main menu |
Support Files
Session support files are available in the repository. If you already cloned the repository, update it and enter the session directory:
$ cd path/to/repository/clone

$ git pull --rebase

$ cd content/en/docs/sessions/03-debugging/

$ ls
demo/  images/  index.md  sol/  work/
If you haven’t cloned the repository yet, clone it and enter the session directory:
$ git clone https://github.com/unikraft/summer-of-code-2021

$ cd summer-of-code-2021/content/en/docs/sessions/03-debugging/

$ ls
demo/  images/  index.md  sol/  work/
Debugging
Contrary to popular belief, debugging a unikernel is in fact simpler than debugging a standard operating system. Since the application and OS are linked into a single binary, debuggers can be used on the running unikernel to debug both application and OS code at the same time. A couple of hints that should help starting:
- In the configuration menu (presented with
make menuconfig), underBuild Optionsmake sure thatDrop unused functions and datais unselected. This prevents Unikraft from removing unused symbols from the final image and, if enabled, might hide missing dependencies during development. - Use
make V=1to see verbose output for all of the commands being executed during the build. If the compilation for a particular file is breaking and you would like to understand why (e.g., perhaps the include paths are wrong), you can debug things by adding the-Eflag to the command, removing the-o [objname], and redirecting the output to a file which you can then inspect. - Check out the targets under
Miscellaneouswhen typingmake help, these may come in handy. For instance,make print-varsenables inspecting at the value of a particular variable inMakefile.uk. - Use the individual
make clean-[libname]targets to ensure that you’re cleaning only the part of Unikraft you’re working on and not all the libraries that it may depend on. This will speed up the build and thus the development process. - Use the Linux user space platform target (
linuxu) for quicker and easier development and debugging.
Using GDB
The build system always creates two image files for each selected platform:
- one that includes debugging information and symbols (
.dbgfile extension) - one that does not
Before using GDB, go to the configuration menu under Build Options and select a Debug information level that is bigger than 0.
We recommend 3, the highest level.
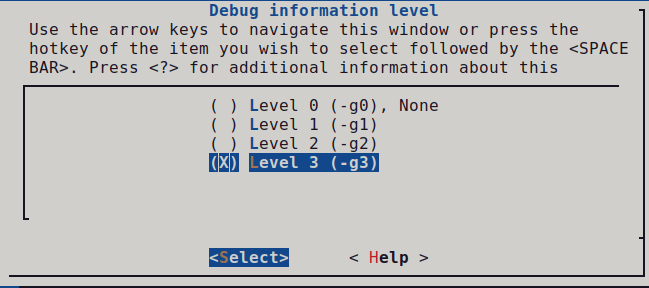
Once set, save the configuration and build your images.
Linuxu
For the Linux user space target (linuxu) simply point GDB to the resulting debug image, for example:
$ gdb build/app-helloworld_linuxu-x86_64.dbg
KVM
For KVM, you can start the guest with the kernel image that includes debugging information, or the one that does not.
We recommend creating the guest in a paused state (the -S option):
$ qemu-system-x86_64 -s -S -cpu host -enable-kvm -m 128 -nodefaults -no-acpi -display none -serial stdio -device isa-debug-exit -kernel build/app-helloworld_kvm-x86_64.dbg -append verbose
Note that the -s parameter is shorthand for -gdb tcp::1234.
To avoid this long qemu-system-x86 command with a lot of arguments, we can use qemu-guest.
$ qemu-guest -P -g 1234 -k build/app-helloworld_kvm-x86_64.dbg
Now connect GDB by using the debug image with:
$ gdb --eval-command="target remote :1234" build/app-helloworld_kvm-x86_64.dbg
Unless you’re debugging early boot code (until _libkvmplat_start32), you’ll need to set a hardware break point:
Hardware breakpoints have the same effect as the common software breakpoints you are used to, but they are different in the implementation.
As the name suggests, hardware breakpoints are based on direct hardware support.
This may limit the number of breakpoints you can set, but makes them especially useful when debugging kernel code.
hbreak [location]
continue
We’ll now need to set the right CPU architecture:
disconnect
set arch i386:x86-64:intel
And reconnect:
tar remote localhost:1234
You can now run continue and debug as you would normally.
Xen
Running Unikraft in Xen
For Xen you first need to create a VM configuration (save it under helloworld.cfg):
name          = 'helloworld'
vcpus         = '1'
memory        = '4'
kernel        = 'build/app-helloworld_xen-x86_64.dbg'
Start the virtual machine with:
$ xl create -c helloworld.cfg
For Xen the process is slightly more complicated and depends on Xen’s gdbsx tool.
First you’ll need to make sure you have the tool on your system.
Here are sample instructions to do that:
[get Xen sources]
$ ./configure
$ cd tools/debugger/gdbsx/ && make
The gdbsx tool will then be under tools/debugger.
For the actual debugging, you first need to create the guest (we recommend paused state: xl create -p), note its domain ID (xl list) and execute the debugger backend:
$ gdbsx -a [DOMAIN ID] 64 [PORT]
You can then connect GDB within a separate console and you’re ready to debug:
$ gdb --eval-command="target remote :[PORT]" build/helloworld_xen-x86_64.dbg
You should be also able to use the debugging file (build/app-helloworld_xen-x86_64.dbg) for GDB instead passing the kernel image.
Tracepoints
Because Unikraft needs a tracing and performance measurement system, one method to do this is using Unikrat’s tracepoint system. A tracepoint provides a hook to call a function that you can provide at runtime. You can put tracepoints at important locations in the code. They are lightweight hooks that can pass an arbitrary number of parameters, which prototypes are described in a tracepoint declaration placed in a header file.
Dependencies
We provide some tools to read and export trace data that were collected with Unikraft’s tracepoint system. The tools depend on Python3, as well as the click and tabulate modules. You can install them by running (Debian/Ubuntu):
sudo apt-get install python3 python3-click python3-tabulate
Enabling Tracing
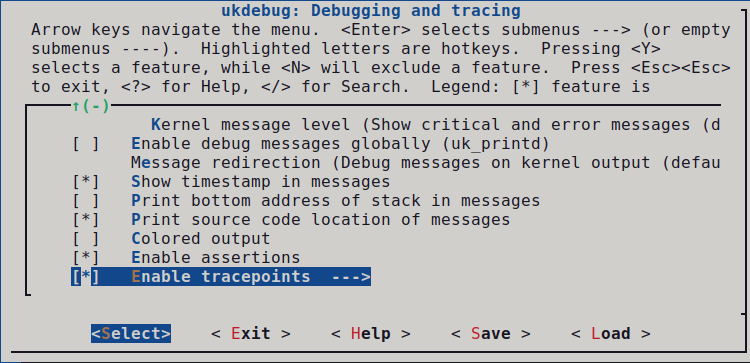
Tracepoints are provided by lib/ukdebug.
To enable Unikraft to collect trace data, enable the option CONFIG_LIBUKDEBUG_TRACEPOINTS in your configuration (via make menuconfig under Library Configuration -> ukdebug -> Enable tracepoints).
The configuration option CONFIG_LIBUKDEBUG_ALL_TRACEPOINTS activates all existing tracepoints.
Because tracepoints may noticeably affect performance, you can alternatively enable tracepoints only for compilation units that you are interested in.
This can be done with the Makefile.uk of each library.
# Enable tracepoints for a whole library
LIBNAME_CFLAGS-y += -DUK_DEBUG_TRACE
LIBNAME_CXXFLAGS-y += -DUK_DEBUG_TRACE

# Alternatively, enable tracepoints of source files you are interested in
LIBNAME_FILENAME1_FLAGS-y += -DUK_DEBUG_TRACE
LIBNAME_FILENAME2_FLAGS-y += -DUK_DEBUG_TRACE
This can also be done by defining UK_DEBUG_TRACE in the head of your source files.
Please make sure that UK_DEBUG_TRACE is defined before <uk/trace.h> is included:
#ifndef UK_DEBUG_TRACE
#define UK_DEBUG_TRACE
#endif

#include <uk/trace.h>
As soon as tracing is enabled, Unikraft will store samples of each enabled tracepoint into an internal trace buffer. Currently this is not a circular buffer. This means that as soon as it is full, Unikraft will stop collecting further samples.
Creating Tracepoints
Instrumenting your code with tracepoints is done by two steps.
First, you define and register a tracepoint handler with the UK_TRACEPOINT() macro.
Second, you place calls to the generated handler at those places in your code where your want to trace an event:
#include <uk/trace.h>

UK_TRACEPOINT(trace_vfs_open, "\"%s\" 0x%x 0%0o", const char*, int, mode_t);

int open(const char *pathname, int flags, ...)
{
      trace_vfs_open(pathname, flags, mode);

      /* lots of cool stuff */

      return 0;
}
UK_TRACEPOINT(trace_name, fmt, type1, type2, ... typeN) generates the handler trace_name() (static function).
It will accept up to 7 parameters of type type1, type2, etc.
The given format string fmt is a printf-style format which will be used to create meaningful messages based on the collected trace parameters.
This format string is only kept in the debug image and is used by the tools to read and parse the trace data.
Unikraft’s trace buffer stores for each sample a timestamp, the name of the tracepoint, and the given parameters.
Reading Trace Data
Unikraft is storing trace data to an internal buffer that resides in the guest’s main memory.
You can use GDB to read and export it.
For this purpose, you will need to load the uk-gdb.py helper script into your GDB session.
It adds additional commands that allow you to list and store the trace data.
We recommend to automatically load the script to GDB.
For this purpose, add the following line to your ~/.gdbinit:
source /path/to/your/build/uk-gdb.py
In order to collect the data, open GDB with the debug image and connect to your Unikraft instance as described in Section Using GDB:
$ gdb build/app-helloworld_linuxu-x86_64.dbg
The .dbg image is required because it contains offline data needed for parsing the trace buffer.
As soon as you let run your guest, samples should be stored in Unikraft’s trace buffer.
You can print them by issuing the GDB command uk trace:
(gdb) uk trace
Alternatively, you can save all trace data to disk with uk trace save <filename>:
(gdb) uk trace save traces.dat
It may make sense to connect with GDB after the guest execution has been finished (and the trace buffer got filled).
For this purpose, make sure that your hypervisor is not destroying the instance after guest shut down (on QEMU add --no-shutdown and --no-reboot parameters).
If you are seeing the error message Error getting the trace buffer. Is tracing enabled?, you probably did not enable tracing or Unikraft’s trace buffer is empty.
This can happen when no tracepoint was ever called.
Any saved trace file can be later processed with the trace.py script. In our example:
$ support/scripts/uk_trace/trace.py list traces.dat
Summary
Practical Work
Support Files
Session support files are available in the repository. If you already cloned the repository, update it and enter the session directory:
$ cd path/to/repository/clone

$ git pull --rebase

$ cd content/en/docs/sessions/03-debugging/

$ ls
demo/  images/  index.md  sol/  work/
If you haven’t cloned the repository yet, clone it and enter the session directory:
$ git clone https://github.com/unikraft/summer-of-code-2021

$ cd summer-of-code-2021/content/en/docs/sessions/03-debugging/

$ ls
demo/  images/  index.md  sol/  work/
01. Tutorial. Use GDB in Unikraft
For this tutorial, we will just start the app-helloworld application and inspect it with the help of GDB.
First make sure you have the following file structure in your working directory:
workdir
|_______apps
|	|_______helloworld
|_______libs
|_______unikraft
Linuxu
For the image for the linuxu platform we can use GDB directly with the binary already created.
$ gdb build/app-helloworld_linuxu-x86_64.dbg
KVM
To avoid using a command with a lot of parameters that you noticed above in the KVM section, we can use qemu-guest.
$ qemu-guest -P -g 1234 -k build/app-helloworld_kvm-x86_64.dbg
Open another terminal to connect to GDB by using the debug image with:
$ gdb --eval-command="target remote :1234" build/app-helloworld_kvm-x86_64.dbg
First you can set the right CPU architecture and then reconnect:
disconnect
set arch i386:x86-64:intel
tar remote localhost:1234
Then you can put a hardware break point at main function and run continue:
hbreak main
continue
All steps described above can be done using the script kvm_gdb_debug located in the work/01-tutorial-gdb/ folder.
All you need to do is to provide the path to kernel image.
kvm_gdb_debug build/app-helloworld_kvm-x86_64.dbg
02. Mystery: Find the secret using GDB
Before starting the task let’s get familiar with some GDB commands.
ni - go to the next instruction, but skip function calls
si - go to the next instruction, but enters function calls
c - continue execution to the next breakpoint
p expr - display the value of an expression
x addr - get the value at the indicated address (similar to p *addr)
whatis arg - print the data type of arg
GDB provides convenience variables that you can use within GDB to hold on to a value and refer to it later. For example:
set $foo = *object_ptr
Note that you can also cast variables in GDB similar to C:
set $var = (int *) ptr
If you want to dereference a pointer and actually see the value, you can use the following command:
p *addr
You can find more GDB commands here Also, if you are unfamiliar with X86_64 calling convention you can read more about it here.
Now, let’s get back to the task.
Download the mystery_kvm-x86_64 file from here.
Copy the mystery_kvm-x86_64 file to the work/02-mystery/ directory.
Navigate to work/02-mystery/ directory.
Use the 2 scripts in the directory (debug.sh and connect.sh) to start the mystery_kvm-x86_64.dbg executable using GDB.
Do you think you can find out the secret?
HINT Use the nm utility on the binary as a starting point.
03. Bug or feature?
There are two kernel images located in the work/03-app-bug/ folder.
One of them is build for Linuxu, the other for KVM.
First try to inspect what it’s wrong with Linuxu image. You will notice that if you run the program you will get a segmentation fault. Why does this happen?
After you figure out what it’s happening with Linuxu image have a look also at the KVM one. It was built from the code source, but when you will try to run it, you will not get a segmentation fault. Is this a bug or a feature?
04. Tutorial. Use Tracepoints.
We will start from the app-helloworld application and we will put two tracepoints.
One at the beginning of the program (after the main) and one at the end of it and these tracepoints should print argc.
First we need to define UK_DEBUG_TRACE and to include uk/trace.h.
#ifndef UK_DEBUG_TRACE
#define UK_DEBUG_TRACE
#endif

#include <uk/trace.h>
After that we have to define those tracepoints that we want to use. In our case it should be something similar with:
UK_TRACEPOINT(start_trace, "%d", int);
UK_TRACEPOINT(stop_trace, "%d", int);
Now we can invoke them inside the main.
int main(int argc, char *argv[])
{
    start_trace(argc);
    start_status();

    printf("Hello world!\n");

    stop_trace(argc);
    stop_status();

    return 0;
}
We also added two simple functions for a better view of tracepoints in GDB.
void start_status(){
    printf("Start tracing\n");
}

void stop_status(){
    printf("Stop tracing\n");
}
You can check the source code for this tutorial in work/04-tutorial-tracepoints.
Now we can build the application, but we need to make sure that we have checked the CONFIG_LIBUKDEBUG_TRACEPOINTS option in the configuration.(Library Configuration -> ukdebug -> Enable tracepoints)
Now we will have to start the application in paused state.
qemu-guest -P -g 1234 -k build/app-helloworld-tracepoints_kvm-x86_64.dbg
In another terminal we will start the GDB:
gdb --eval-command="target remote :1234" build/app-helloworld-tracepoints_kvm-x86_64.dbg
Put a hardware break to main and continue until there.
(gdb) hbreak main
(gdb) continue
Now we can put a break to first function start_status to check if the first tracepoint is successful.
To show all the tracepoints we can use uk trace.
GDB configuration
Don’t forget to put this linesource /path/to/your/build/uk-gdb.py in your GDB file configuration ~/.gdbinit.
Otherwise you won’t be able to use uk trace.(gdb) break start_status
(gdb) continue
(gdb) uk trace
0000116012362374 start_trace: 2
We notice that we got an output and that the tracepoint was reached.
We continue until the second trace point and we will save all the tracepoints obtained with the command uk trace save traces.dat
(gdb) break stop_status
(gdb) continue
(gdb) uk trace save traces.dat
Saving traces to traces.dat ...
Now we can read all the tracepoints obtained using trace.py from the main repo located in unikraft/support/scripts/uk_trace/trace.py.
The output will be similar to this:
       time  tp_name        msg
-----------  -----------  -----
 5321091993  start_trace      2
11121071844  stop_trace       2
05. Can you trace your own program?
Modify your Echo-back Server application implemented in the first session so that each time the server responds with a message a tracepoint with the corresponding message will be activated.
Save all your tracepoints in a traces.dat file and show them in a user-friendly view with trace.py.
06. Nginx with or without main? That’s the question.
Let’s try a new application based on networking, Nginx.
First clone the repository for app-nginx and put it in the right hierarchy.
Then you need to create Makefile and Makefile.uk.
Make sure to respect the order of libraries in Makefile. For more information check lib-nginx repository.
Do you observe something strange? Where is the main.c?
Deselect this option Library Configuration -> libnginx -> Provide a main function and try to make your own main.c that will run Nginx.
- Nginx + Makefile
- Nginx without
provide main function
07. Bonus. Bad ELF in Town
We managed to build an ELF file that is valid when doing static analysis, but that can’t be executed.
The file is bad_elf, located in the work/07-bad-elf/ folder.
Running it triggers a segmentation fault message.
Running it using strace show an error with execve().
~/Doc/U/summer-of-code-2021/c/e/d/s/0/w/05-bad-elf > ./bad_elf
[1]    125458 segmentation fault  ./bad_elf
~/Doc/U/summer-of-code-2021/c/e/d/s/0/w/05-bad-elf > strace ./bad_elf
execve("./bad_elf", ["./bad_elf"], 0x7ffc9ca2e960 /* 66 vars */) = -1 EINVAL (Invalid argument)
+++ killed by SIGSEGV +++
[1]    125468 segmentation fault (core dumped)  strace ./bad_elf
The ELF file itself is valid.
You can check using readelf:
$ readelf -a ./bad_elf
The issue is to be detected in the kernel.
Use either perf, or, better yet ftrace to inspect the kernel function calls done by the program.
Identify the function call that sends out the SIGSEGV signal.
Identify the cause of the issue.
Find that cause in the manual page elf(5).
08. Give Us Feedback
We want to know how to make the next sessions better. For this we need your feedback. Thank you!
Further Reading
Feedback
Was this page helpful?
Glad to hear it! Please tell us how we can improve.
Sorry to hear that. Please tell us how we can improve.